Study of the aftershocks of the 2010 Mw 8.8 Maule mega earthquake

A collaborative project by:

Carmen Pro, Elisa Buforn, Amaya Fuenzalida, Sergio Ruiz and Raul Madariaga


View of Constitucion a few days after the Maule earthquake. In the fore-front the cGPS
instrument. The beach and the Cafes, Hotels etc are gone. Courtesy of Ch. Vigny


Contents

  1. Introduction
  2. The Aftershocks
  3. The depth problem
  4. The water column oscillations
  5. References

Introduction

The Maule earthquake of Mw 8.8 had several large aftershocks some of which reached the magnitude 7.5 or even larger.

With the exception of the two shallow aftershocks that occurred on 11 March 2011 near the town of Pichilemu in northern part of the rupture zone, few of those events have been studied. (Ref:

One of the main questions is the depth of the aftershocks because aftershock studies by Lange et al (2012), Rietbrock et al (2012) had difficulties in determining the depth of Maule aftershocks. The aftershocks depth obtained by these studies were very variable, many events had depths that put them down to 40 km bellow the trench. In a recent study the USGS group led by Hayes et al (2013) had much better results.

In this study we will use the modeling of body waves together with far field stacks to obtain more accurate locations and, at the same time, obtain models of the sources of these aftershocks.

This work is based on the presentaion we made at the 2013 EUG meeting in Vienna (Pro et al, 2013)


The Aftershocks

Aftershocks in the NEIC HDF database, M>6.0 March 2010- January 2013

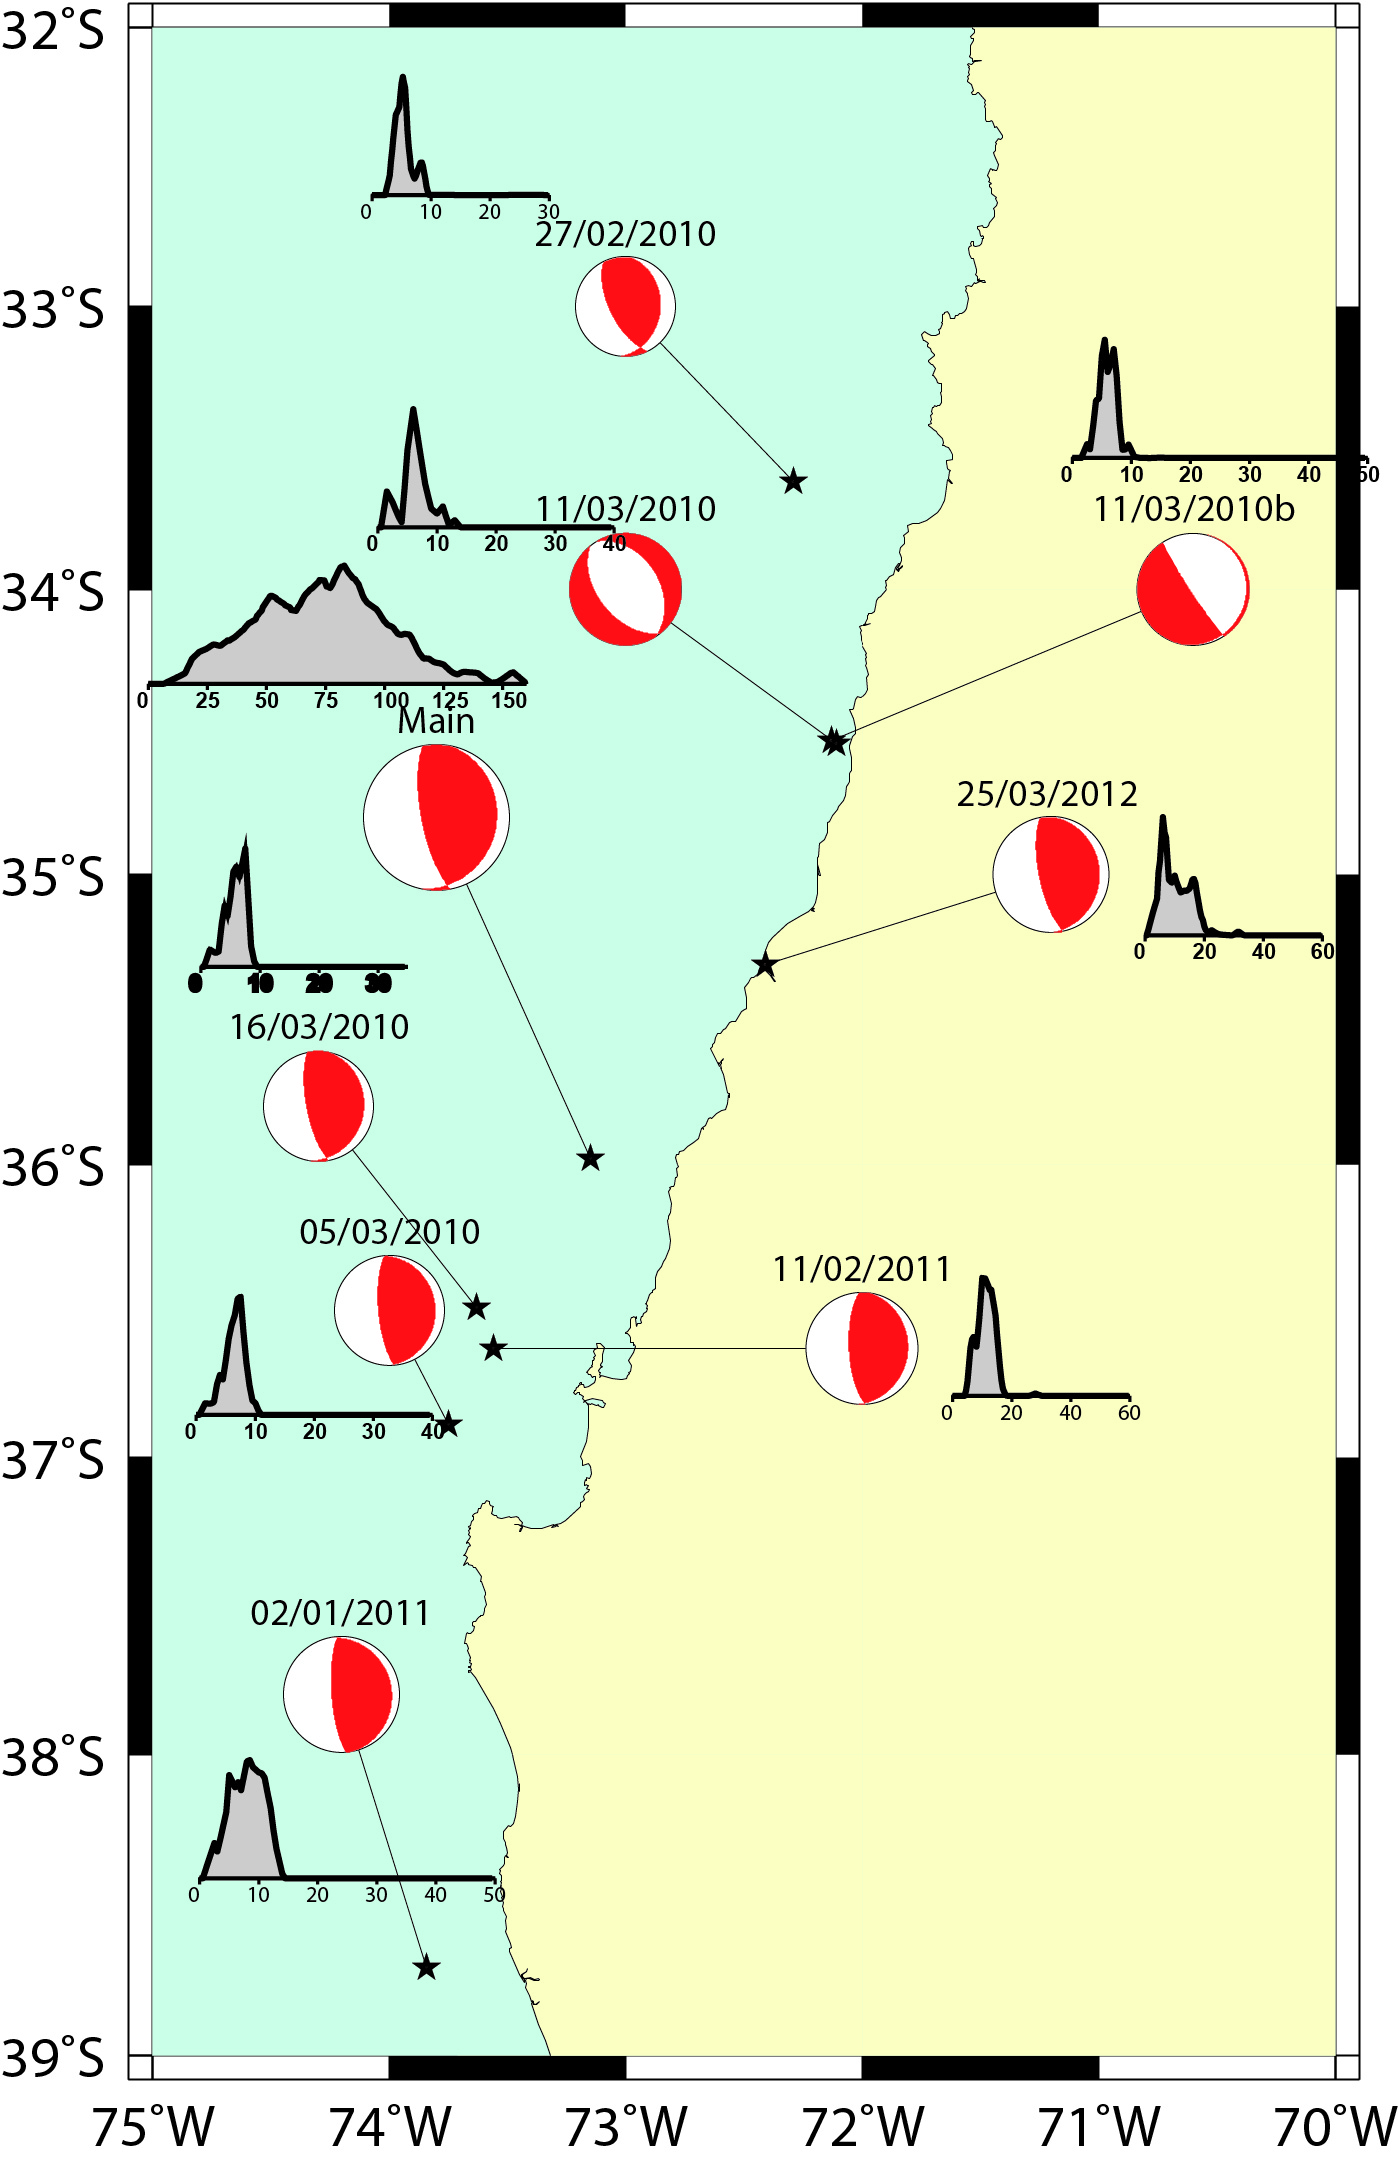
  27  2 2010  6 34  11.53  -72.898   -36.122   22.90   8.80   | DONE number 1
  27  2 2010  8  1  23.01  -75.048   -37.773   35.00   7.40   | data not available. Event is buried in microseismic noise
  27  2 2010 10 30  36.40  -71.955   -33.281   35.00   6.10    
  27  2 2010 17 24  30.59  -73.208   -36.354   19.00   6.10
  27  2 2010 19  0   6.86  -71.828   -33.422   31.10   6.20   | DONE number 2
  28  2 2010 11 25  35.92  -71.617   -34.903   46.00   6.20  
   3  3 2010 17 44  25.04  -73.360   -36.610   20.00   6.10
   4  3 2010  1 59  48.67  -72.125   -33.216   24.20   6.00
   5  3 2010  9 19  36.38  -73.223   -36.631   29.90   6.10  
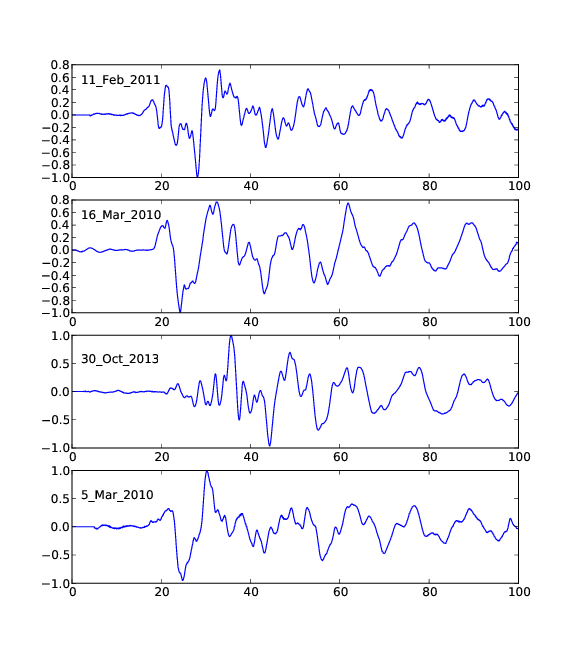
   5  3 2010 11 47   6.82  -73.374   -36.665   18.00   6.60   | DONE number 3
  11  3 2010 14 39  43.95  -71.891   -34.290   11.00   6.90   | DONE number 4
  11  3 2010 14 55  27.51  -71.799   -34.326   18.00   7.00   | DONE number 5
  11  3 2010 15  6   2.13  -72.004   -34.470   31.50   6.00
  15  3 2010 11  8  28.96  -73.158   -35.802   14.00   6.20
  16  3 2010  2 21  57.94  -73.257   -36.217   18.00   6.70   | DONE number 6 
  28  3 2010 21 38  28.00  -73.385   -35.387   29.90   6.00
   2  4 2010 22 58   7.56  -72.878   -36.227   24.00   6.00
  23  4 2010 10  3   6.18  -72.969   -37.529   32.00   6.00
   3  5 2010 23  9  44.79  -73.454   -38.072   19.00   6.30
  14  7 2010  8 32  21.49  -73.310   -38.067   22.00   6.60   | DONE number 7 
   9  9 2010  7 28   1.72  -73.412   -37.034   16.00   6.20
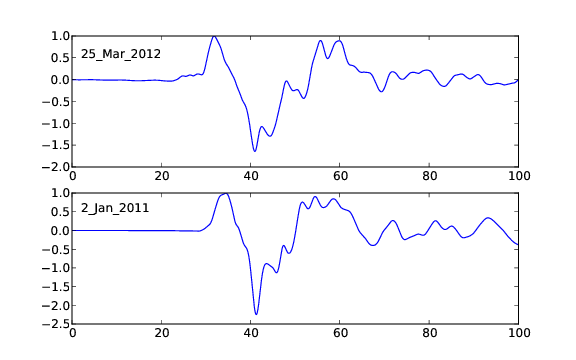
   2  1 2011 20 20  17.78  -73.326   -38.355   24.00   7.20   | DONE numebr 8 
  11  2 2011 20  5  30.91  -72.960   -36.422   26.00   6.90   | DONE number 9
  12  2 2011  1 17   1.41  -72.954   -37.027   16.00   6.10
  13  2 2011 10 35   6.74  -73.176   -36.649   17.00   6.00
  14  2 2011  3 40   9.92  -72.834   -35.380   21.00   6.70   |  DONE number 10
   1  6 2011 12 55  22.38  -73.691   -37.578   21.00   6.30   |  En cours number 13 
  16  7 2011  0 26  12.64  -71.832   -33.819   20.00   6.10
  23  1 2012 16  4  52.98  -73.030   -36.409   20.00   6.10
  25  3 2012 22 37   6.00  -72.217   -35.200   40.70   7.10   |  done number 11 
   7  6 2012  4  5   4.52  -70.570   -36.074    8.00   6.00
  31 10 2013  4  5   4.52  -70.570   -36.074    8.00   6.00   |  done number 12 


Aftershock distribution

This figures show the aftershocks that are listed in the NEIC data base
and those studied by Carmen Pro and Elisa Buforn

There are a few aftershocks of magnitudes around 6 that could potentially be modelled. Should we try it? I will check a few


CMT of 30/11/2013


There are perhaps a few more aftershocks we can study?
The rotated distribution in coordinates aligned with the trench are shown in the next figure:


The depth problem


This figure is plotted in the EW direction, we must plot it in the direction normal to the trench, roughly N20E. Then the plate interface must be taken from local data. We know that for this region.

Event 7 Is not at the correct position because the plot should be taken not in the NS direction, but in the direction perpendicular to the trench.

The 3 events 3, 6 , 8 plus the recent event from 30/10/2013 produced water layer oscillations. They must be extremely shallow.


SOLUTIONS


The water column oscillations


These were first observed in Chile after the 1995 Antofagasta earthquake of 31 July 1995 by Ihmle and Madariaga (1996)


The water column oscillations are shown in this figure where we show 4 of the shallow events. I still have to check two more aftershocks, specially one on 27 February 2010 shown in Carmen's figure.


The deeper events, on the other hand have simpler wave forms. There are only two for the moment. I have to add one more event of 27/02/2010


Finally the Pichilemu events to be discussed next week

References

  1. High Frequency aspects Ruiz et al (2012)

  2. General features of the earthquake Vigny et al, (2011) Science

  3. A very good early paper Delouis et al (2010)

  4. Brief history of the gap Madariaga et al (2010)

  5. Backpropagation by Kiser and Ishii (2011)

  6. Backpropagation Koper and Lay (2011)

  7. Aftershocks Lange et al (2012)

  8. Best aftershocks Hayes et al (2013)

  9. Rietbrock Rietbrock (2012)

  10. GPS final Moreno et al (2012)