|
Published in Nature, Vol 364, July 1993, pp. 138-142. : The displacement field of the Landers earthquake mapped by radar interferometry. Didier Massonnet, Marc Rossi, César Carmona, Frédéric Adragna, Gilles Peltzer, Kurt Feigl, and Thierry Rabaute
ABSTRACT: Geodetic data, obtained by ground- or space-based techniques, can be used to infer the distribution of slip on a fault that has ruptured in an earthquake. Although most geodetic techniques require a surveyed network to be in place before the earthquake, satellite images, when collected at regular intervals, can capture co-seismic displacements without advance knowledge of the earthquake's location. Synthetic aperture radar (SAR) interferometry, first introduced in 1974 for topographic mapping can also be used to detect changes in the ground surface, by removing the signal from the topography. Here we use SAR interferometry to capture the movements produced by the 1992 earthquake in Landers, California. We construct an interferogram by combining topographic information with SAR images obtained by the ERS-1 satellite before and after the earthquake. The observed changes in range from the ground surface to the satellite agree well with the slip measured in the field, with the displacements measured by surveying, and with the results of an elastic dislocation model. As a geodetic tool, the SAR interferogram provides a denser spatial sampling (100 m per pixel) than surveying methods and a better precision (~3 cm) than previous space imaging techniques.
|
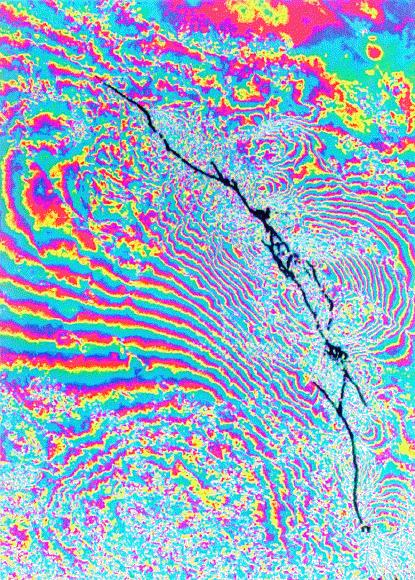
detail of earthquake area
|
|
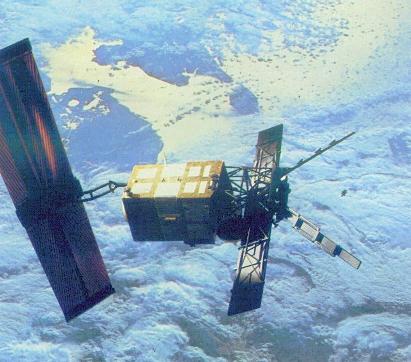
Published in Nature, Vol 375, June 1995, pp. 567-570. Deflation of Mount Etna monitored by spaceborne radar interferometry. Didier Massonnet, Pierre Briole, and Alain Arnaud
ABSTRACT: Ground-based measurements of volcano deformation can be used to assess eruptive hazard, but require the costly (and often hazardous) installation and maintenance of an instrument network. Here we show that spaceborne radar interferometry, which has already shown its utility in mapping earthquake-related deformation, can be used to monitor long-term volcano deformation. Two families of synthetic aperture radar images, acquired from ascending and descending orbits by the satellite ERS-1, and looking at Mount Etna from opposite sides, cover the time period from 17 May 1992 to 24 October 1993, and include the second half of Etna's most recent eruption. Despite artefacts of the interferometric technique, we can observe a volcano-wide deflation, which is an expected consequence of the eruption, but which had not previously been appreciated. We quantify it using a simple model based on the change of pressure in a sphere located in an elastic half-space; the modelled deformation increases linearly with time until the end of the eruption. Our results show that it will be possible to use this technique to detect the inflation of volcanic edifices that usually precedes eruptions.
|

etna interferogram superimposed on topography
|