
The past decade has seen a rapid increase in the number and spatial density of continuously operating Global Navigation Satellite System (GNSS) stations to monitor crustal deformation in tectonically active regions or simply serve as reference stations for surveying applications. The leading technique as of today is the Global Positioning System (GPS), with two major deformation monitoring networks currently in operation, the Plate Boundary Observatory (PBO) in the Western U.S. with ~2000 stations and the GEONET network in Japan with ∼5000 stations.
These networks record linear site displacements due to plate motions and interseismic strain accumulation on active faults, as well as transient-deformation events of various origins—volcanic, tectonic, or hydrologic — whose spatiotemporal scales span several orders of magnitude. Our ability to objectively and reliably detect these transients is of primary importance because they contain information on the rheological properties and stress state of near-surface faults, as well as of the Earth’s crust and mantle. Detecting transients, however, is challenging for two reasons. First, the very large amount of data now available in large geodetic networks make the visual inspection of time series at each site very time consuming and well nigh impossible. Second, the amplitude of these transients can be close to — or lie even below — the background noise inherent to geodetic time series.
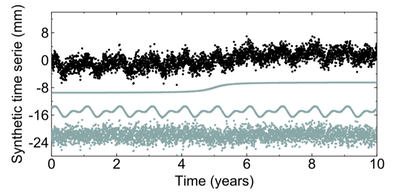
Univariate synthetic time series (top, black dots) composed of, from top to bottom in gray, a transient displacement, annual and semiannual harmonic functions, as well as colored and white noise.
We explore the Multichannel Singular Spectrum Analysis (M-SSA), an advanced time series analysis method that simultaneously takes advantage of the spatial and temporal correlations in geophysical fields, is well suited to extract geophysically relevant information from GPS position time series. M-SSA extracts empirical basis functions that represent the common modes of spatiotemporal variability of the data set. The main benefit of this method is to allow unraveling oscillations and trends with nonconstant slopes embedded in time series without using any a priori knowledge about their period and amplitude or their spatiotemporal structures.
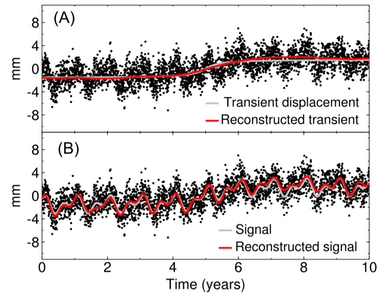
Reconstruction of the (a) transient displacement and the (b) seasonal oscillations in our synthetic example. Black dots = synthetic time series, gray lines = synthetic transient and oscillatory signals embedded in the synthetic time series, red lines = reconstructed signals using M-SSA. (Figure 5a) The reconstruction using the first T-PC and corresponding T-EOF captures the transient displacement signal. (Figure 5b) The reconstruction using the first five T-PCs and corresponding T-EOFs additionally captures the seasonal signal.