The Western Mediterranean encompasses a segment of the boundary between the Nubia and Eurasia plates along which their relative motion transitions from strike-slip in the west along the Azores-Gloria transform fault system, to oblique convergence in the east. The plate boundary is marked by significant crustal seismicity, with some large events such as the 1980, Mw 7.3 El Asnam, 1985, MS 6.0 Constantine, and 2003, Mw 6.8 Boumerdes earthquakes.
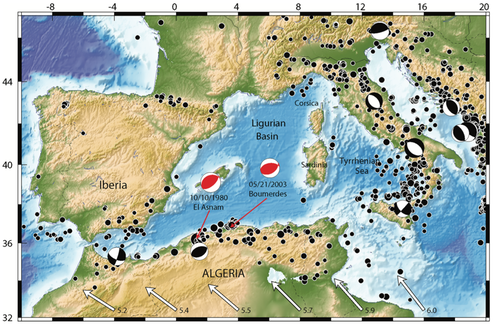
Figure: Active tectonic framework of the western Mediterranean basin. The 2003 May 21, Boumerdes earthquake and the 1980 October 10 El Asnam events are shown in red. Focal mechanisms are shown in black for other M w > 6.0 earthquakes (Harvard CMT database). Black circles show magnitude greater than 4.5 earthquakes (NEIC database). White arrows at the bottom of the figure show model velocities for the Nubia plate with respect to Eurasia. From Mahsas et al., 2008.
A first compilation of GPS velocities in the Western Mediterranean and Europe in 2004 showed that the Nubia—Eurasia oblique convergence in the Western Mediterranean was mostly accommodated by transpressional deformation in north Africa and southern Iberia. Very little strain, if any, appeared to be transferred into the Eurasian plate. This finding is still valid today. An additional conundrum, observed in this 2004 study and yet again in a 2019 one by Bougrine et al., is the inconsistency between the present-day Nubia-Eurasia angular rotation and the one determined by the Nuvel1 or Morvel geological plate motion models.The origin of this misfit remains to be understood.
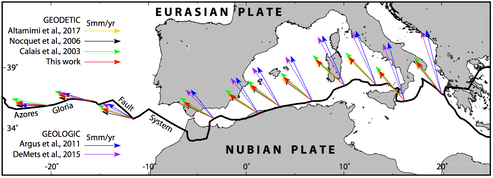
Figure: Predicted velocities along the Eurasia–Nubia Plate boundary. From Bougrine et al., 2019.
We initiated GPS measurements in Algeria following the 2003 Boumerdes earthquake in collaboration with the Centre de Recherche en Astronomie Astrophysique et Géophysique (CRAAG) d’Alger. By remeasuring a legacy network, we showed that the rupture occurred on an offshore blind reverse fault. This was the first indication that offshore faults could account for part of the Africa-Eurasia relative plate motion in the western Mediterranean and, hence, present a significant seismic threat for the Western Mediterranean basin. Postseismic GPS measurements then confirmed the rupture location and showed significant shallow afterslip updip of the coseismic rupture.
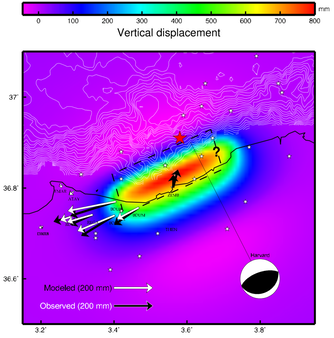
Figure: Observed (black arrows) and modeled (white arrows) horizontal coseismic displacements. The surface projection of the modeled rupture is shown by the dashed black line. Background colors show modeled vertical coseismic displacements. Thick black line: coastline. Thin white contours: bathymetry. White stars: aftershock locations. Red start: main shock.The Harvard focal mechanism and epicenter are also shown. From Yelles et al., 2004.
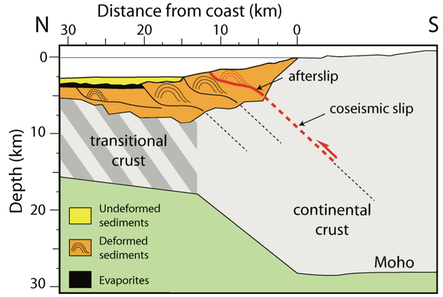
Figure: North–south cross-section of the Algerian margin offshore Boumerdes illustrating the spatial relationship between the coseismic rupture (western half of the rupture plane), the area of afterslip estimated here, and mapped faults along the margin. No vertical exaggeration. From Mahsas et al., 2008.
Motivated by the Boumerdes earthquake, the CRAAG installed a 54–site network of continuously–recording GPS stations, the REGAT (“REseau Géodésique de l’ATlas”) geodetic network. This network fills a hole in the description of kinematics of the Nubia—Eurasia plate boundary in the Mediterrean and complements existing networks elsewhere in the Mediterranean. A. Bougrine used the dat from this network to compute the first geodetic velocity field in Algeria. Using a simple block kinematic approach, we show that the velocities are consistent with the presence of an active, reverse, offshore fault system that runs along the toe of the Algerian margin, with a slip rate decreasing from west to east. In the western half of Algeria, the GPS data do not require additional faults system on-land. In the eastern half, GPS velocities require an E–W-trending strike-slip fault separating two blocks that accounts for the strike-slip component of the overall plate motion. We also observe significant shortening between the Saharan platform and the Aures range in southeastern Algeria.
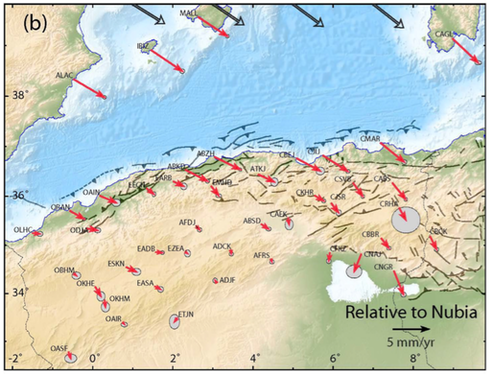
Figure: GPS velocities shown with respect to Nubia. Major tectonic features are from Rabaute and Chamot-Rooke (2014). Error ellipses are 95 per cent confidence. Top arrows show the predicted NU–EU velocities from this work. From Bougrine et al., 2019.