GEODYSSEA GPS Results


note : most (although not all) of the following text can be found in Simons et al, 1999 submitted to GRL


Abstract. We present here the final geodetic results obtained in the framework of the `GEODYnamics of South and South-East Asia' (GEODYSSEA) project. The goal of this project is to study the overall plate motions in this region. For this purpose, a network of 42 stations was observed with GPS during two field campaigns in 1994 and 1996. The data were analyzed independently by four groups using different software packages and analysis strategies. The resulting individual network solutions were combined into 2 campaign averaged coordinate solutions. The precision of both coordinate solutions was found to be 4-7 mm for the horizontal, and 1 cm for the vertical component. Subsequently, these campaign solutions were merged into one unique solution, which was accurately mapped into the International Terrestrial Reference Frame solution of 1996 (ITRF-96) (Altamimi and Boucher, 1996). The global accuracy of this solution with respect to ITRF-96 is of the order of 1 cm, while the resolution of the relative horizontal velocities is estimated to be at the level of 2-3 mm/yr. This solution represents the latest official geodetic result of the GEODYSSEA project and it is used as the basis for all scientific interpretations, which have been and will be published in separate papers. As an immediate result the velocity estimates of a part of the network provided the first direct measurement of a relative motion of the Sundaland block with respect to Eurasian plate.

Introduction
The `GEODYnamics of South and South-East Asia' (GEODYSSEA) project (Wilson et al., 1998) was initiated in 1991 as a joint EC-ASEAN project, to study the complex geodynamic processes in S.E. Asia. These result from the convergence and collision of the Eurasian, Philippine and Australian plates at relative velocities of up to 10 cm per year. A detailed geological description of the geodynamics of S.E. Asia can be found in e.g. (Rangin et al. 1990). Previous investigations in S.E. Asia using GPS for both regional and more localized surveys were mostly restricted to a single national territory. By contrast, the GEODYSSEA project aims to determine the tectonic motions across the entire S.E. Asia region and provides a reference frame into which all detail networks can be fitted. The project was carried out by a large international group of participants, including 22 agencies and institutions in 14 different Asian and European countries. In here, we present the geodetic results of the project which are based on two GPS measurement campaigns in 1994 and 1996. A solution for the station coordinates and velocities was obtained by combining the results of four different analysis groups.

The GEODYSSEA Network
The actual GEODYSSEA network covers an area of about 4000 by 4000 km, and includes 42 observation points throughout South and South-East Asia. The selected points provide a good coverage of all the major tectonic blocks in the region. Prior to the first GPS measurements, the observation points were monumented in bedrock with specially designed markers, yielding a re-centering accuracy of 0.2 mm (reinking and Klotz, 1995). Though a network of continuously operating stations would provide the best results, it is expensive and difficult to operate in remote areas in S.E. Asia. The campaign style observations of the GEODYSSEA project provide a good alternative in this case, although the results have to be carefully interpreted, because they might have been affected by transient site effects, temporal variations and episodic motions. To remove at least partially these effects, and minimize the effects of common errors, almost all points in the GEODYSSEA network were occupied simultaneously and continuously measured for a campaign period of 5 days. To each GPS campaign data set, the available data for 4 stations of the Australian Survey and Land Information Group (AUSLIG) on the Australian plate was added. To facilitate the positioning of the network in a global reference frame, data from 6 stations of the International GPS Service for Geodynamics (IGS) tracking network (beutler et al., 1994) in the region was included. Two major observation campaigns were conducted in the course of the project by GFZ and BKG (formerly IfAG), and a third was recently completed in November 1998. Only standardized Trimble 4000 SSE GPS receivers and antennae were employed, though data supplied by AUSLIG and obtained from the IGS was collected with (Turbo)Rogue and Ashtech receivers connected to Dorne Margolin antennae. The GEODYSSEA-94 zero epoch GPS campaign took place from 28 November to 2 December 1994, and contained 231 station-days (254 including one additional day with only part of the network observed) of GPS data. The network was re-observed during the GEODYSSEA-96 first repetition campaign, between 18 and 22 April, 1996. 220 station-days (280 including 4 additional days) were collected this time. The loss of data during both campaigns due to receiver failures, operational mistakes and logistical problems is almost negligible.

GPS Data Analysis
Four analysis groups (DEOS, ENS, GFZ and BKG) computed solutions for the complete GEODYSSEA 1994 and 96 campaign data sets, using their favored software and analysis strategy. The GPS packages used include four of the state-of-the-art systems currently in use, i.e. GIPSY-OASIS II v2.1 (Blewitt et al., 1988), GAMIT v9.4 (King et al., 1993), EPOS v3.0 (Angermann et al., 1997) and BERNESE v4.0 (Rothacher et al., 1996a). All analysis centers computed daily fiducial-free network solutions using the ionosphere-free linear combination of GPS phase and pseudorange data. To account for tropospheric effects, the zenith path delay was estimated (continuously or at regular time intervals, depending on the GPS software) for each station. Because different antennae were used in the network, the groups applied antenna phase center corrections of (Rothacher et al., 1996b). The datum of the solutions was defined by the combined IGS orbits and the corresponding earth rotation parameters, which were held fixed. Further and more detailed information on the individual analyses can be found in (angermann et al, 1998) and further down in the "more-information-section" of this page.

Multi-day averaged coordinate solutions
The daily solutions of each group were combined into multi-day averaged solutions for each group with the 3D-Motion software (Noomen et al., 1993), which eliminated any systematic differences between the various network solutions by computing optimized 7 parameter Helmert transformations using a least squares adjustment. In this process, station solutions identified as outliers with respect to the averaged solution were removed. The preliminary multi-day solutions were compared, so that common and/or individual processing problems could be detected and resolved. Where required, the groups re-processed the GPS data, after which the final multi-day averaged solutions were computed. At this point, an unique opportunity arose to also compare the performance of the various GPS packages. The daily repeatabilities of the station coordinates (Table 1), ranging from 3 to 6.5 mm for the horizontal components and averaging at about 9 mm in the height, provide sufficient evidence that the various solutions are of similar quality. This shows that the internal precision of the GEODYSSEA network is very high, at a level comparable to the IGS global network solutions.

Table1. Daily Coordinate Repeatabilities of Each Analysis Group.
Computing
center
Software RMS residuals (mm)
North East Up
1994 Campaign
DEOS (6 days) GIPSY 3.2 6.9 9.5
ENS (5 days) GAMIT 3.5 4.9 8.8
GFZ (5 days) EPOS 3.6 6.3 8.7
BKG (5 days) BERNESE 4.0 6.9 10.3
1996 Campaign
DEOS (9 days) GIPSY 3.2 6.7 10.1
ENS (9 days) GAMIT 3.3 6.0 8.5
GFZ (9 days) EPOS 3.0 6.3 8.1
BKG (5 days) BERNESE 3.1 4.8 9.5
Please note that not all groups processed the additional campaign days. Inclusion of these smaller networks in 1996 slightly degraded the repeatability, but this was necessary because a few sites could not be occupied during the offical campaign days. ENS also resolved the phase ambuigities in their solutions, which shows up in the east component of the coordinate repeatabilities. Therefore, these values should not be interpreted as a direct measurement of the performance of each GPS software.


Campaign averaged coordinate solutions
For each campaign, the multi-day averaged solutions from DEOS, ENS, GFZ and BKG were combined with the 3D-Motion software into one 1994, and one 1996 campaign coordinate solution. The campaign solutions were both based on four equally weighted contributions, since the multi-day averaged solutions of each group were of the same quality. The internal consistency of all contributing individual solutions (Table 2) is less than 5 mm in horizontal and less than 10 mm in vertical. This result demonstrates the high quality of the computations. Furthermore, it proves the high quality standard and high performance of the four software packages GIPSY, GAMIT, EPOS and Bernese. However, for an overall quality assessment of the network accuracy, this result may be too optimistic because it does not account for possible biases caused by the commonly used IGS combined orbits, the same IGS station data, and the identical antenna phase center corrections applied by all groups. These biases have to be considered for an overall quality assessment of the network accuracy.
Table2. Internal consistency of the Campaign Averaged Coordinate Solutions
GPS Measurements
Campaign
RMS residuals (mm)
North East Up
GEODYSSEA-94 1.9 3.8 7.4
GEODYSSEA-96 2.5 5.0 6.6


The effect of different IGS orbits and the constellation of the IGS station on the station coordinates has been investigated by (angermann et al., 1998a). The influence of the IGS orbits on the internal network accuracy is in the order of 1-3 mm, while the effect of different IGS station constellations is 1-2 mm. Other effects like reference frame definition, antenna phase center models, troposphere, etc..., were also investigated GEODYSSEA Error Budget. Taking into account these biases, the campaign averaged station coordinates have an accuracy between 4-7 mm for the horizontal component and 1 cm for the height. The final combined 1994 and 1996 coordinate solutions have a higher resolution than their individual contributions, and have been used to obtain a single set of GEODYSSEA station coordinates and derived velocities in a common reference frame.

Combining the campaign solutions in ITRF94 and/or ITRF96
Although the available time series for the GEODYSSEA network at present only contains two solutions, they are of high quality and cover a time interval of 16.5 months. This is sufficient to obtain an accurate first estimate of the horizontal station velocities in this region. When the final combined solution was computed and distributed among all participants of the project, the ITRF-94 reference frame (Altamimi and Boucher, 1994) was the latest one available. In here, the final GEODYSSEA results are presented in both ITRF-94 and ITRF-96 because this is a more accurate reference frame which contains improved IGS station coordinates and velocity estimates. This is especially true for some of the regional IGS stations (Kitab and Taiwan) that were included in the GEODYSSEA data analysis. The AUSLIG station at Cocos Island became part of the IGS global network in 1996, and its coordinates and velocity estimates are also available in ITRF-96. Therefore 6 IGS sites (instead of 5 with ITRF-94) could be used to map the GEODYSSEA solution in ITRF-96. This was done, by first projecting one campaign solution with 3D-Motion onto an ITRF-94 or ITRF-96 solution, that contains the positions of the selected IGS stations at the time of the campaign. This ITRF mapped campaign solution was then used as a reference solution in a second 3D-Motion run to map the other campaign solution upon, thereby applying this time velocity constraints to the IGS stations according to ITRF. This technique perfectly aligns the IGS station velocities (misfits show up completely in the coordinate residuals), and delivers a single averaged station coordinate set and corresponding station displacement rates in ITRF-94 or ITRF-96 with the best (formal) representation of the accuracy. The epoch for the final combined solution was set at 1994 for the ITRF-94 solution and 1996 for the ITRF-96 solution, since any difference in the actual station velocity with respect to ITRF-94 or ITRF-96 would propagate through time, making the GEODYSSEA 1996 solution more suited to be first transformed to ITRF-96, and then used as a reference solution for the 1994 campaign solution, or the other way around for the GEODYSSEA solution mapped in ITRF-94. Initially, with only 5 IGS stations included in the GEODYSSEA solution (Kitab (Usbekistan),Taipei (Taiwan), Tsukuba (Japan), Tidbinbilla and Yarragadee (in Australia)) an accurate mapping in the ITRF-94 could not yet be obtained. Table 3 shows the IGS coordinate residuals, which are significantly higher for the 1996 projection, with values up to almost 3 cm. This suggests that some of the IGS stations velocities observed by GEODYSSEA may be different from their average velocity in ITRF-94, and hence degrade the quality of the transformation (see figure 9 in the GEODYSSEA Error Budget section.

Table3. Initial results network solution mapping in ITRF-94
IGS Station
1994 Solution (1) 1996 Solution (2)
North East Up North East Up
Kitab 2.1 -4.2 1.2 14.6 -0.7 17.4
Tidbinbilla -0.8 -4.6 -3.3 9.0 4.5 27.9
Tsukuba -10.5 -3.2 -5.3 20.3 -17.1 -9.6
Yarragadee -5.1 6.0 -2.3 11.4 -6.1 -1.7
Taiwan 7.2 -0.6 7.2 -19.9 13.8 -15.0
Coordinate residuals (in millimeters) after transformation w.r.t. (1) the ITRF-94 coordinates and (2) the ITRF-94 velocity constraints used between the 1996 and 1994 campaign epoch. Please note that for Kitab, velocity values were set according to the NUVEL-1A model, because it is not available from ITRF-94. A DORIS value is available in ITRF-94 but the NUVEL-1A velocities showed better agreement with the GPS velocities obtained by the major analysis centres.


In order to deal with this problem, more globally distributed IGS stations were added to the original data set (Algonquin and Fairbanks in North America, Kokkee Park in Hawai, and Kootwijk, Wetzell and Madrid in West-Europe), and additional global computations were performed. It was found that Taipei was particularly affecting the orientation and accuracy of the mapping in ITRF-94, Kittab and Tsukuba in a less severe manner. Those stations time series indeed show high residuals and that a different station velocity may indeed apply between the 1994 and 1996 GEODYSSEA campaign epochs. The relative accuracy of the GEODYSSEA station coordinates remained almost unchanged (1-2 mm) with 6 additional IGS stations included in the network solution. After these re-computations, the coordinate residuals for the IGS stations improved considerably ( Table 4 ), indicating a good mapping of the GEODYSSEA solution in the ITRF-94 was realized.

Table4. Final results network solution mapping in ITRF-94.
IGS Station
1994 Solution (1) 1996 Solution (2)
North East Up North East Up
Kitab 4.8 -7.1 5.8 8.2 16.7 9.1
Tidbinbilla -1.4 -5.0 -1.4 -1.3 7.2 21.7
Tsukuba -5.2 -1.7 -2.9 5.8 -10.8 -19.5
Yarragadee -1.5 5.8 0.2 4.4 -1.9 -5.6
Taiwan (free) -12.3 0.4 -9.7 - - -
Coordinate residuals (in millimeters) for (1) and (2) as described in Table 3. The additional 6 IGS stations were not used in the final transformation as their coordinate solution is less accurate due to the scarcity of the global stations that were included.


Following the release of the ITRF-96 solution, we re-did the mapping of the GEODYSSEA solution in this reference frame. With the 6 nearby IGS tracking sites included in the GEODYSSEA solutions (Kitab (Usbekistan),Taipei (Taiwan), Tsukuba (Japan), Cocos Island, Tidbinbilla and Yarragadee (all in Australia)), an accurate representation of the GEODYSSEA network in ITRF-96 was obtained right away, avoiding the problems we experienced with the mapping in ITRF-94. Table 5 shows the coordinate residuals of the IGS sites for the 1994 and 1996 solution transformations. These coordinate residuals are quite consistent for both campaign solutions and have an Root-Mean-Square (RMS) value of 5 to 10 mm for the horizontal, and 9 to 12 mm for the vertical position. Some slightly higher coordinate differences can be noticed in Table 5 for the IGS sites Kitab and Tidbinbilla, which are located at the edges of the network relatively far away from the dense core of GPS sites. This may be due to the chosen regional-type approach of including only available nearby IGS sites in the local network to transform the network onto ITRF-96. Also, although 2 IGS stations (Taiwan and Tsukuba) are located on or close to possible active deformation zones, their coordinate residuals confirm that their observed motion in between both GEODYSSEA campaigns was aseismic and in agreement with ITRF-96.

Table5. Final results network solution mapping in ITRF-96.
IGS Station
1996 Solution (1) 1994 Solution (2)
North East Up North East Up
Cocos Island 7.5 9.7 9.9 6.3 9.5 -5.7
Kitab 5.8 20.6 0.1 8.9 3.6 12.2
Taiwan 4.7 -4.5 -10.6 -9.5 3.8 -14.5
Tidbinbilla -4.0 -4.8 15.0 1.6 9.5 22.5
Tsukuba 4.9 -8.2 -1.6 9.3 -14.7 -3.3
Yarragadee -2.8 -2.8 -4.2 7.0 -9.0 1.8
Coordinate residuals for the 6 IGS stations included in the GEODYSSEA coordinate solutions (in millimeters) after transformation w.r.t. (1) their ITRF-96 coordinates and (2) the ITRF-96 velocity constraints used between the 1996 and 1994 campaign epochs.


Comparison of the IGS station coordinates in the final averaged GEODYSSEA solution, with their ITRF-96 values, reveals RMS coordinate residuals of 5, 8 and 7 mm for the three components. This shows that the global accuracy with respect to the ITRF-96 is of the order of 1 cm for both the horizontal and the vertical station position. The station velocity estimates in ITRF-96 have a formal accuracy of 2-3 mm/yr for the horizontal directions, and 5 mm/yr for the height (Table 7). An exception are the velocity estimates for the stations KEND and REDO on Sulawesi, which are less accurate because these sites could only be occupied 1 to 3 days in both campaigns (in 1996 only outside the nominal 5 day period). An important outcome of the data analysis are the station velocities computed along with the station coordinates. The final combined solution containing the coordinates and velocity estimates of 39 GEODYSSEA sites (in ITRF-94) can be found in (Simons et al., 1998). For reference, the velocities predicted by the No-Net-Rotation (NNR) NUVEL-1A model (Demets et al., 1994) are also included. The estimation of magnitudes and directions of the kinematic features active in the region, proved to be possible with a (based on formal statistics that may be too optimistic) relative horizontal resolution of 2-3~mm/yr. These results have been interpreted by the geologists and geophysicists participating in the project.

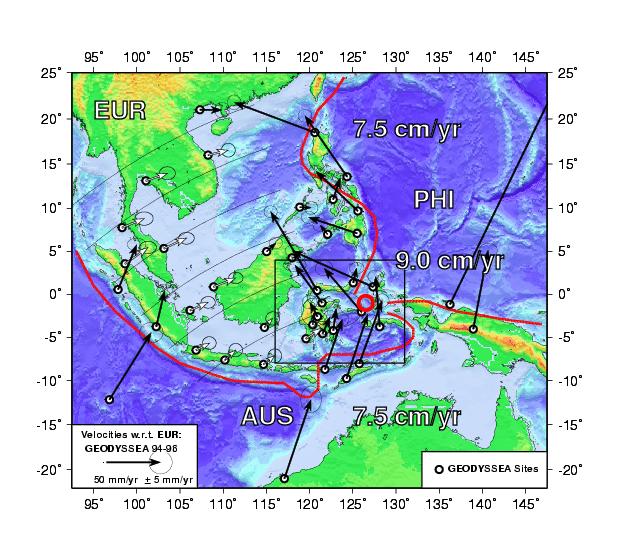
Plate 1 : GEODYSSEA velocities in ITRF94 reference frame
Plate 2 : GEODYSSEA velocities in ITRF96 reference frame
Plate 3 : Comparison of GEODYSSEA velocities in ITRF94 and ITRF96 reference frames


Table 6 : GEODYSSEA velocities in ITRF94 reference frame
Table 7 : GEODYSSEA velocities in ITRF96 reference frame


Results and Discussion
An important finding was that the results seem to confirm that the Sundaland block has a distinct relative motion with respect to the stable part of the Eurasian plate (Wilson et al., 1998; Chamot-Rooke et al., 1998). Furthermore, the precise locations of the active plate boundaries in the region covered were identified and significant new information on local deformation processes and measurements of co-seismic displacements at various sites was obtained (Michel et al., 1998). The latter is clearly visible in the velocity plots for the GEODYSSEA site on the island Biak (BIAK), Indonesia, which moved more than a meter horizontally (ten times more the normal rate) due to two heavy earthquakes which occured there in February of 1996. Earthquakes also have affected the station velocities of the stations on Tomini (TOMI), Indonesia and LaoAgo (LAOA), Philippines. A high regional and global accuracy of the GEODYSSEA velocities is the backbone of all findings. Therefore the previous representation of the GEODYSSEA station coordinates and velocities in ITRF-94 are now being replaced in by the more accurate representation in ITRF-96. With respect to the previous solution in ITRF-94, the station velocities thereby have changed on average by -4, +3.5 and -3 mm/yr in north, east and up directions. The previously observed motion of the Sundaland block was verified in ITRF-96. The Euler vector for the Sundaland block was derived by fitting a (2-dimensional) rigid block velocity model to 12 stations (NONN, CHON, KUAL, MEDA, PHUK, TABA, TANJ, BATU, BAKO, UJPD, BUTU, BALI), assumed to be located on this stable block. The site in Brunei, also considered to be on the Sundaland block, was not included in the computations because it seems affected by intraplate deformation. The results indicate a rotation pole of about 0.37 deg/Ma located at 43 N and 61 W in ITRF-96. These values differ significantly from the NNR-NUVEL-1A prediction for the Eurasian plate, which gives a rotation pole of 0.23 deg/Myr located at 51 N and 113 W. When the block modeled velocities for these stations are subtracted from their actual values, small residuals are obtained, with an RMS of 3 mm/yr in the north and 4 mm/yr in the east component. As these residuals are consistent with the quality assessment of the final combined GEODYSSEA solution, this confirms that the 12 stations indeed describe the motion of a stable Sundaland block. The major tectonic boundaries of the Sundaland block are shown on the plots. A third GEODYSSEA GPS campaign was successfully carried out by GFZ and BKG in November 1998. When the data of these campaigns becomes available, further verification of the presented geodetic results will take place, and probably also a first good estimate of the vertical motions in this region will be obtained. At the same time, a GPS measurement campaign was organized by DEOS on the island of Sulawesi, Indonesia to measure additional GEODYSSEA sites installed by ENS to densify the GEODYSSEA network in the triple junction area. This area has been actively under investigations by Scripps Institution of Oceanography (SIO), Rensealler Polytechnic Institute (RPI), ENS, and DEOS in cooperation with BAKOSURTANAL since 1992. In particular a transect across the Palu-Koro fault in Sulawesi, installed by SIO/RPI/BAKO, has been measured every year since and yield very interesting features : extremely rapid left-lateral strike-slip motion up to 4 cm/yr, and complex interactions with the nearby Minahassa trench.

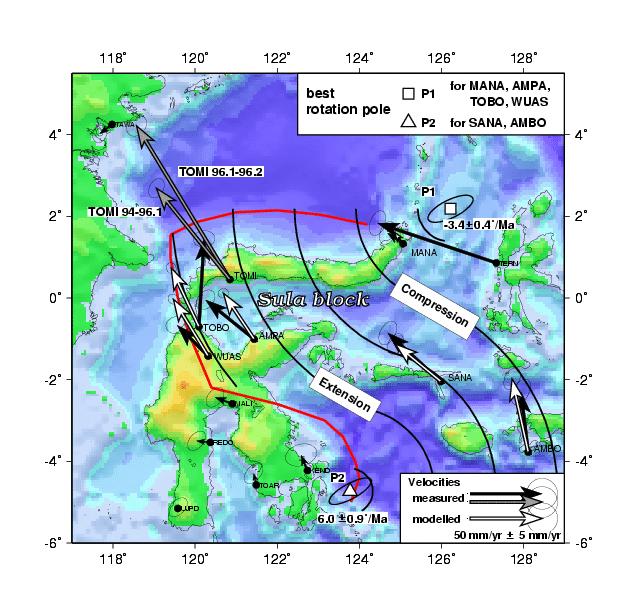
Plate 4 : The Sunda block rotation. Sunda block stations velocities are depicted by white arrows. They are representative of the rotation of a rigid plate about a pole situated south of Australia.
Plate 5 : Complex tectonic of the highgly deformed Sula block in the triple junction area (Sulawesi, Indonesia).


Plate 6 : Strike-slip shear deformation zone across the Palu-Koro fault in Sulawesi, Indonesia). The deformation accumulated across the fault is not constant with time, but rather increasing after the 1996 January 1st magnitude 8 earthquake which happened up north on the Minahassa trench.
Plate 7 : Velocity profile across the Palu-Koro fault. The fault is locked on depth of arond 6-10 km, and shows a far-field velocity up to 42 mm/year (see modelisation).


More Information on GPS data processing, combined solution and error budget


Data processing at ENS, Paris, France

Data processing at DEOS, Delft, The Netherlands

Data processing at IFAG (now BKG), Frankfurt am Main, Germany

Data processing at GFZ, Potsdam, Germany

Combined Solution

Error Budget of the GPS solution